
Figure 1. CAT Generator Monitoring Screen
Richard Temple
temple@wcu.edu
Manufacturing Engineering Technology
Western Carolina University
Cullowhee, North Carolina
INTRODUCTION
Active learning strategies applied to engineering technology courses
are student centered approaches to teaching and learning in order to apply
theory based principles to real life situations. Active learning
is an educational paradigm shift from a teacher-centered approach of traditional
lecture, planned assignments, exams, and evaluation to a student centered
approach to learning. Examples of active learning to engineering
technology courses include hands-on projects, multimedia technology, Java
Applets, student delivery and presentation of researched material, hands-on
experiments, discussion groups, pre-class mini tests, and group problem
solving. Samples (1996) noted that in comparing active learning students
with traditional teaching in a thermodynamics course, over the long run
"the active learning section and the discovery / design section scored
significantly higher" compared to traditional teaching methods. Research
in active learning cites several proven benefits. These benefits
noted by Cartwright (1994) include: more appealing courses, excellent class
attendance, increase in student discussions and participation, a better
grasp of material, increased performance on quizzes and exams, and more
material covered. Additionally, active learning techniques have shown
to bring about positive responses from students and enables students to
grasp difficult concepts better than the traditional lecture format (Clough,
1998 ASEE). Active learning focuses on the premise that students
learn best by doing and becoming actively engaged in the learning process
(Rossetti, 2000; Adams, 2000).
To facilitate active learning in a quality control course, real operating
data from a remote site was downloaded for SPC analysis. This paper
looks at a data acquisition framework used in obtaining remote data from
methane powered Caterpillar (CAT) engines for active learning exercises.
The CAT engines are currently running at a land fill in Prince William
County, VA.
DATA ACQUISITION
Minnesota Electric (who ownes and operates the power generation station in Prince William County, VA) uses a process monitoring and control software similar to Siemens WinnCC, Wonder Ware, or Labview. Any process control and data acquisition software that is capable of saving data in an Excel or comma separated variable (CSV) format can be used for quality analysis. Figure 1 shows one of several process control layout screens containing monitoring parameters for one of the CAT generator sets. The figure is a real time display of several operating parameters. Currently none of the data are analyzed for any type of trends, frequency distributions, or process control. Additional process control software screens are: building layouts sensor locations, generator sensors locations, and methane output sensor layout. In the case of Minnesota Electric, historical data used for generator and engine condition monitoring is stored on the hard drive of the site controller's personal computer. A special file specifically for quality control analysis by students was setup to collect selected operating parameters and made available for upload. This file and its parameters are password protected so that students cannot damages files on the remote computer. Data on the host personal computer is uploaded via modem and PC Anywhere software to a campus computer in the CAD lab. PC Anywhere is a Symantec software product which offers instant access and transfer of data and applications from a host to remote computer. Any application running on the host computer can be controlled and seen on the remote computer. A trial ware version of PC Anywhere is available at http://www.pt.lu/comnet/desc/pcanywhere.html Figure 2 shows the main page of PC Anywhere. The rectangle icons are titled the "action bar" and allows you switch between host and remote modes, view and edit properties of global options and packages, and exit pcAnywhere. The PC pictured icons are titled "connection items" and contain the connection information needed to let others connect to your computer (host mode) or connect to another computer (remote mode). PC Anywhere provides three default connection types:direct, modem, and network, which appear as icons in this window. Process control parameters in Excel format can be downloaded via senior project web page at http://paws.wcu.edu/metproj/
The Cad computers are networked via a Novell server. All department
related web pages reside on this server allowing student access from any
internet connected PC. Figure 3 shows a block diagram of the data flow
from the remote site to a student PC. The process control software
stores data on the hard drive of the host computer. Selected parameters
of investigation (i.e. front bearing temperature) are configured in the
process control software to store comma separated variable (CSV) data to
a specific folder in preparation for upload. PC Anywhere then uploads
all data in that folder to the campus server. Windows Task Scheduler
commands PC Anywhere to upload data once a week or as needed. PC
Anywhere must be installed on the host and remote computer, and configured
for dial up and data transfer. All uploaded data is stored in a specific
folder on the campus computer. This file can be down loaded from
a web page. Same data for download is available at http://paws.wcu.edu/metproj/
Table 1 shows a partial list of engine and facility monitoring parameters.
Any one of these parameters can be selected for quality control analysis.
SPC analysis for selected parameters useful to Minnesota Electric include
trend analysis on bearing temperatures, frequency distributions of power
output levels over time, and control charts for methane output.
Figure 1. CAT Generator Monitoring Screen
Gen 1 Engine 1 Filter Pressure Out
ZTR Gas Skid Panel Ambient Air Temp
Gen 1 Engine 1 Jacket Water Pump Pressure
Outside Air Temp
Gen 1 Engine 1 Cylinder 1 Temp
Engine Room Air Temp
Gen 1 Engine 1 Cylinder 2 Temp
Control Room Air Temp
Gen 1 Stator Temp
Landfill Gas Flow to Flare
Gen 1 Engine 1 After Cooler Temp
Landfill Gas Flow to Generators
Gen 1 Front Bearing Temp
Flare Skid Pressure In
Gen 1 Rear Bearing Temp
Flare Skid Pressure Out
Control Room Methane Detector
Gas Compressor Pressure In
Engine Room Methane Detector
Gas Compressor Pressure Out
Table 1. Partial List of Engine and Facility Monitoring Parameters
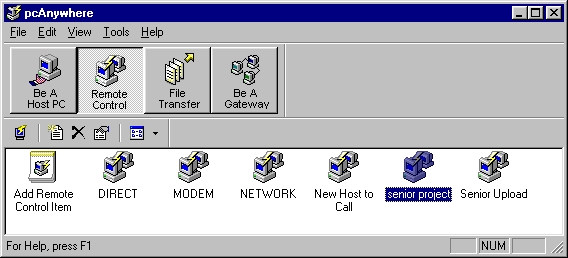
Figure 2. PC Anywhere Main Screen
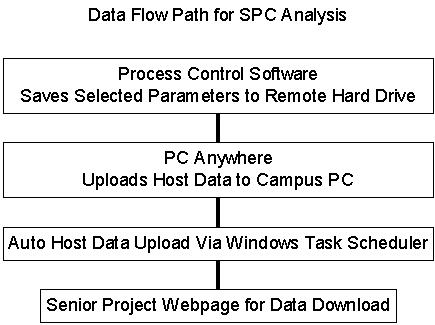
Figure 3. Block Diagram of Data Flow
SPONSOR ARRANGEMENT AND ISSUES
The campus computer can view and transfer files directly from the hard drive of the host computer. Obviously this has the potential for disaster if students or uninformed university personnel obtain access. Therefore, only one department instructor has the password to access the hard drive on the remote computer. The acquisition of data and operating parameters from the process control software can only be changed by the consent of the sponsor. Passwords that control alarm limits and set points are not available to students or faculty. Students will not have access to PC Anywhere and can only download data from the campus server that is periodically uploaded from the remote landfill computer.
Several confidentiality issues require addressing. Data confidentiality is maintained by the coding of the data. Each field parameter has a heading not distinguishable to the general population. Only students taking the quality course will have access to the true meaning of the process parameter field codes. Anyone in the world can look at the data, but only students and faculty know what the true column field codes represent.
The cost of implementing this project is minimal. The sponsor
and the university must have PC Anywhere on respective computers.
On this project PC Anywhere was already in use by Minnesota Power.
Older versions of the software are adequate and can be obtained for approximately
$40.00. A modem was required at a cost of $20.00 and the department
must pay the long distance phone calls for dialing into the host system.
Adequate communication between the university and the sponsor via e-mail
limit the frequency of phone calls and thus the number of data uploads,
potentially reducing the long distance phone calls to 1 per week.
STUDENT AND SPONSOR BENEFITS
The sponsor benefits by receiving quality control data analysis on key operating parameters at no cost. However, it should be explained to the sponsor that students are not employees of the university and are not "consultants" so to speak. The sponsor should be made aware that although it is the students intent to generate useful results, the students do have limitations related to their experience and expertise. Data analysis can include: trend analysis, control charts, run charts, descriptive statistics, capability analysis, histograms, time series pots, and probability plots.
The true value of this project has yet to be fully appreciated and developed. Potential dollar savings for Minnesota Electric are unwanted downtimes through condition trend monitoring of generator bearings and engine operating parameters. The current process control software is limited to alarm set point monitoring and no trend or time series analysis is performed. Statistical distributions for various parameters could benefit upper management and can be obtained at low cost, particularly when staff responsibilities are at maximum limit. Engineers are often "data rich and analysis poor" and could benefit by having an additional people (students) look at parameters of interest for quality, reliability, and productivity improvements.
Students are required to make industry quality reports and data analysis to Minnesota Electric. The on-line data analysis quality control report writing process provides a realistic representation of industry expectations in this area. Writing reports for a company that will use the results has more meaning to students than writing a report that an instructor will evaluate. The industrial connection increases the necessity of student writing at a professional level, with no tolerance for common writing errors. Garrett (2000) noted several advantages of integrating live data into quality control courses:
CONCLUSIONS
The process of gathering real time process control data for quality control analysis as an active learning tool is relatively simple, requiring low cost software and hardware. One key to successful implementation is the support and agreement the university has with the company sponsor. Proprietary issues need to examined along with proper data coding and firewall protection on the sponsors end. The instructor will benefit by working closely with the sponsor in determining real data analysis needs. The internet world of instantaneous access has its benefits, however selecting a production facility close to the university can yield more productive learning. Sponsor facilities located relatively close to the university also enable students to see the process running up close. Seeing the process and communicating with the site engineer sparks more student interest, generates quality reports, forces students to think about the quality and accuracy of data collected, and broadens their engineering technology education beyond solving textbook problems.
BIBLIOGRAPHY
Adams, S. G. (2000). Project Based Learning in a Statistical
Quality Control Course. ASEE Annual Conference Proceedings, Washington,
DC: The
American Society for Engineering
Education
Cartwright, A. N. (1998). Cooperative Learning Environments for Engineering
Courses. ASEE Annual Conference Proceedings, Washington, DC:
The
American Society for Engineering
Education
Clough, D. E. (1998). Bringing Active Learning into the Traditional
Classroom: Teaching Process Control the Right Way. ASEE Annual
Conference
Proceedings, Washington,
DC: The American Society for Engineering Education
Garrett, R. (2000). Industrial Partners Providing their Production
Facility as an On-line Quality Control Laboratory. ASEE Annual
Conference Proceedings,
Washington, DC: The
American Society for Engineering Education
Rossetti, M. D. (2000). Using Active and Cooperative Learning in
Industrial Engineering Education. ASEE Annual Conference Proceedings,
Washington,
DC: The American Society
for Engineering Education
Samples, J. W. ( 1996). Becoming a Better Teacher: Adjusting
from the Baseline. ASEE Annual Conference Proceedings, Washington,
DC: The
American Society for Engineering
Education.